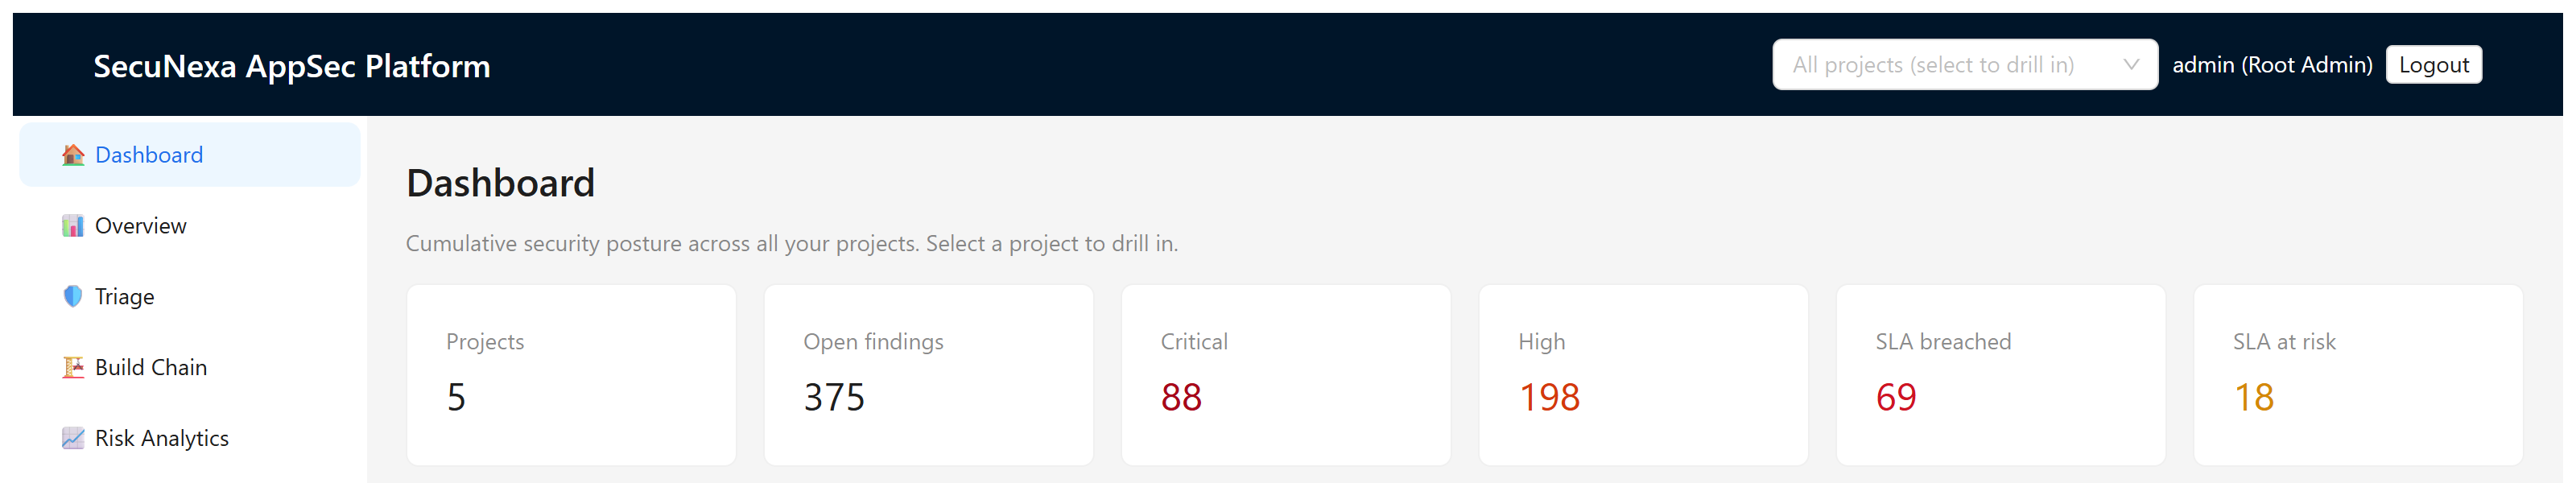
The SecuNexa dashboard
Nine engines in. One decision queue out.
Scanners produce findings. Security programs need decisions. The SecuNexa dashboard turns the output of every engine into one prioritized, auditable workflow, running entirely inside your perimeter.
Portfolio overview illustrative
1,284
open findings
37
critical
212
fixed this week
9/9
engines reporting
payments-api · sql injection · known exploited
base-image · vulnerable openssl · fix available
mobile-app · cleartext traffic · in triage
What the dashboard does
From findings to decisions
Cross-engine correlation
Findings from all nine engines land in one place, deduplicated by stable fingerprints and linked when they describe the same risk.
Prioritization that reflects attackers
Severity, exploit likelihood, known-exploited status, and reachability combine into one ranked queue, so teams fix what matters first.
Triage that sticks
Suppressions and decisions are keyed to content-based fingerprints. A finding you triaged stays triaged across builds, branches, and rescans.
Role-based access control
Seven roles from root administrator to read-only, scoped per project, with an immutable audit log behind every state change.
Reports and evidence
Executive summaries, compliance reports, and full evidence exports in the formats your auditors and customers ask for.
Policy and build gates
Define what is allowed to ship. CI integration fails builds on new criticals, policy violations, or SLA breaches.
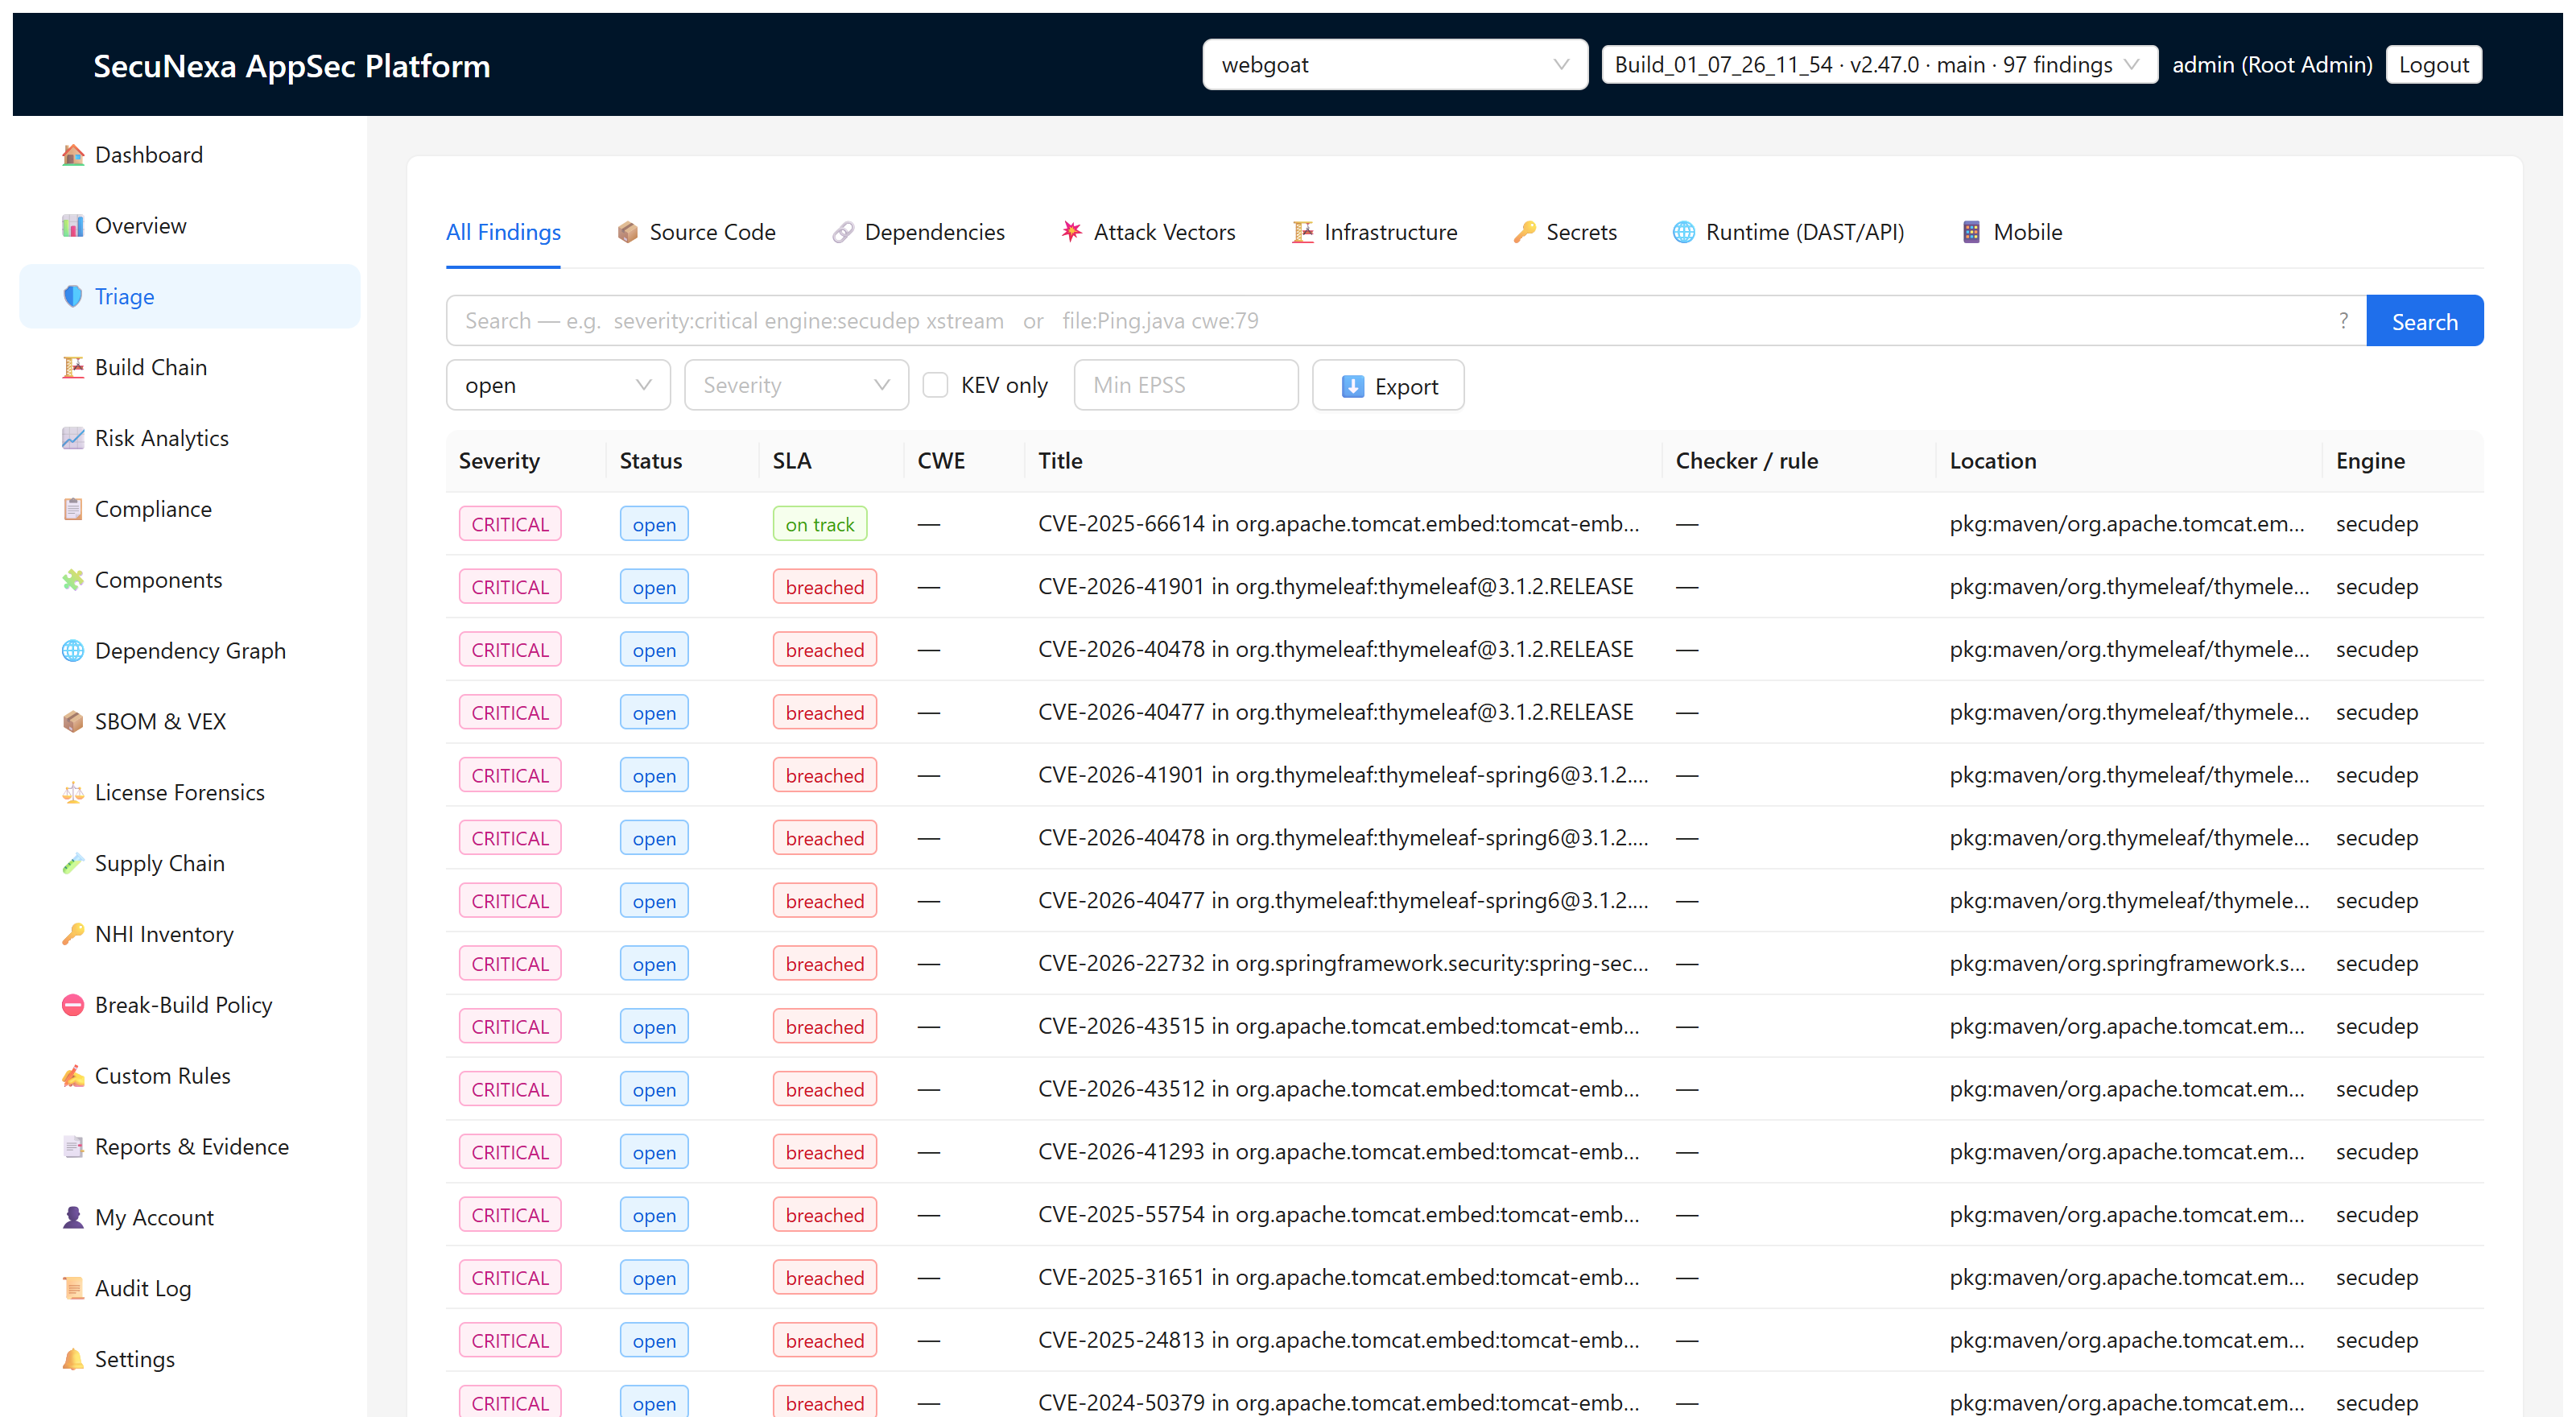
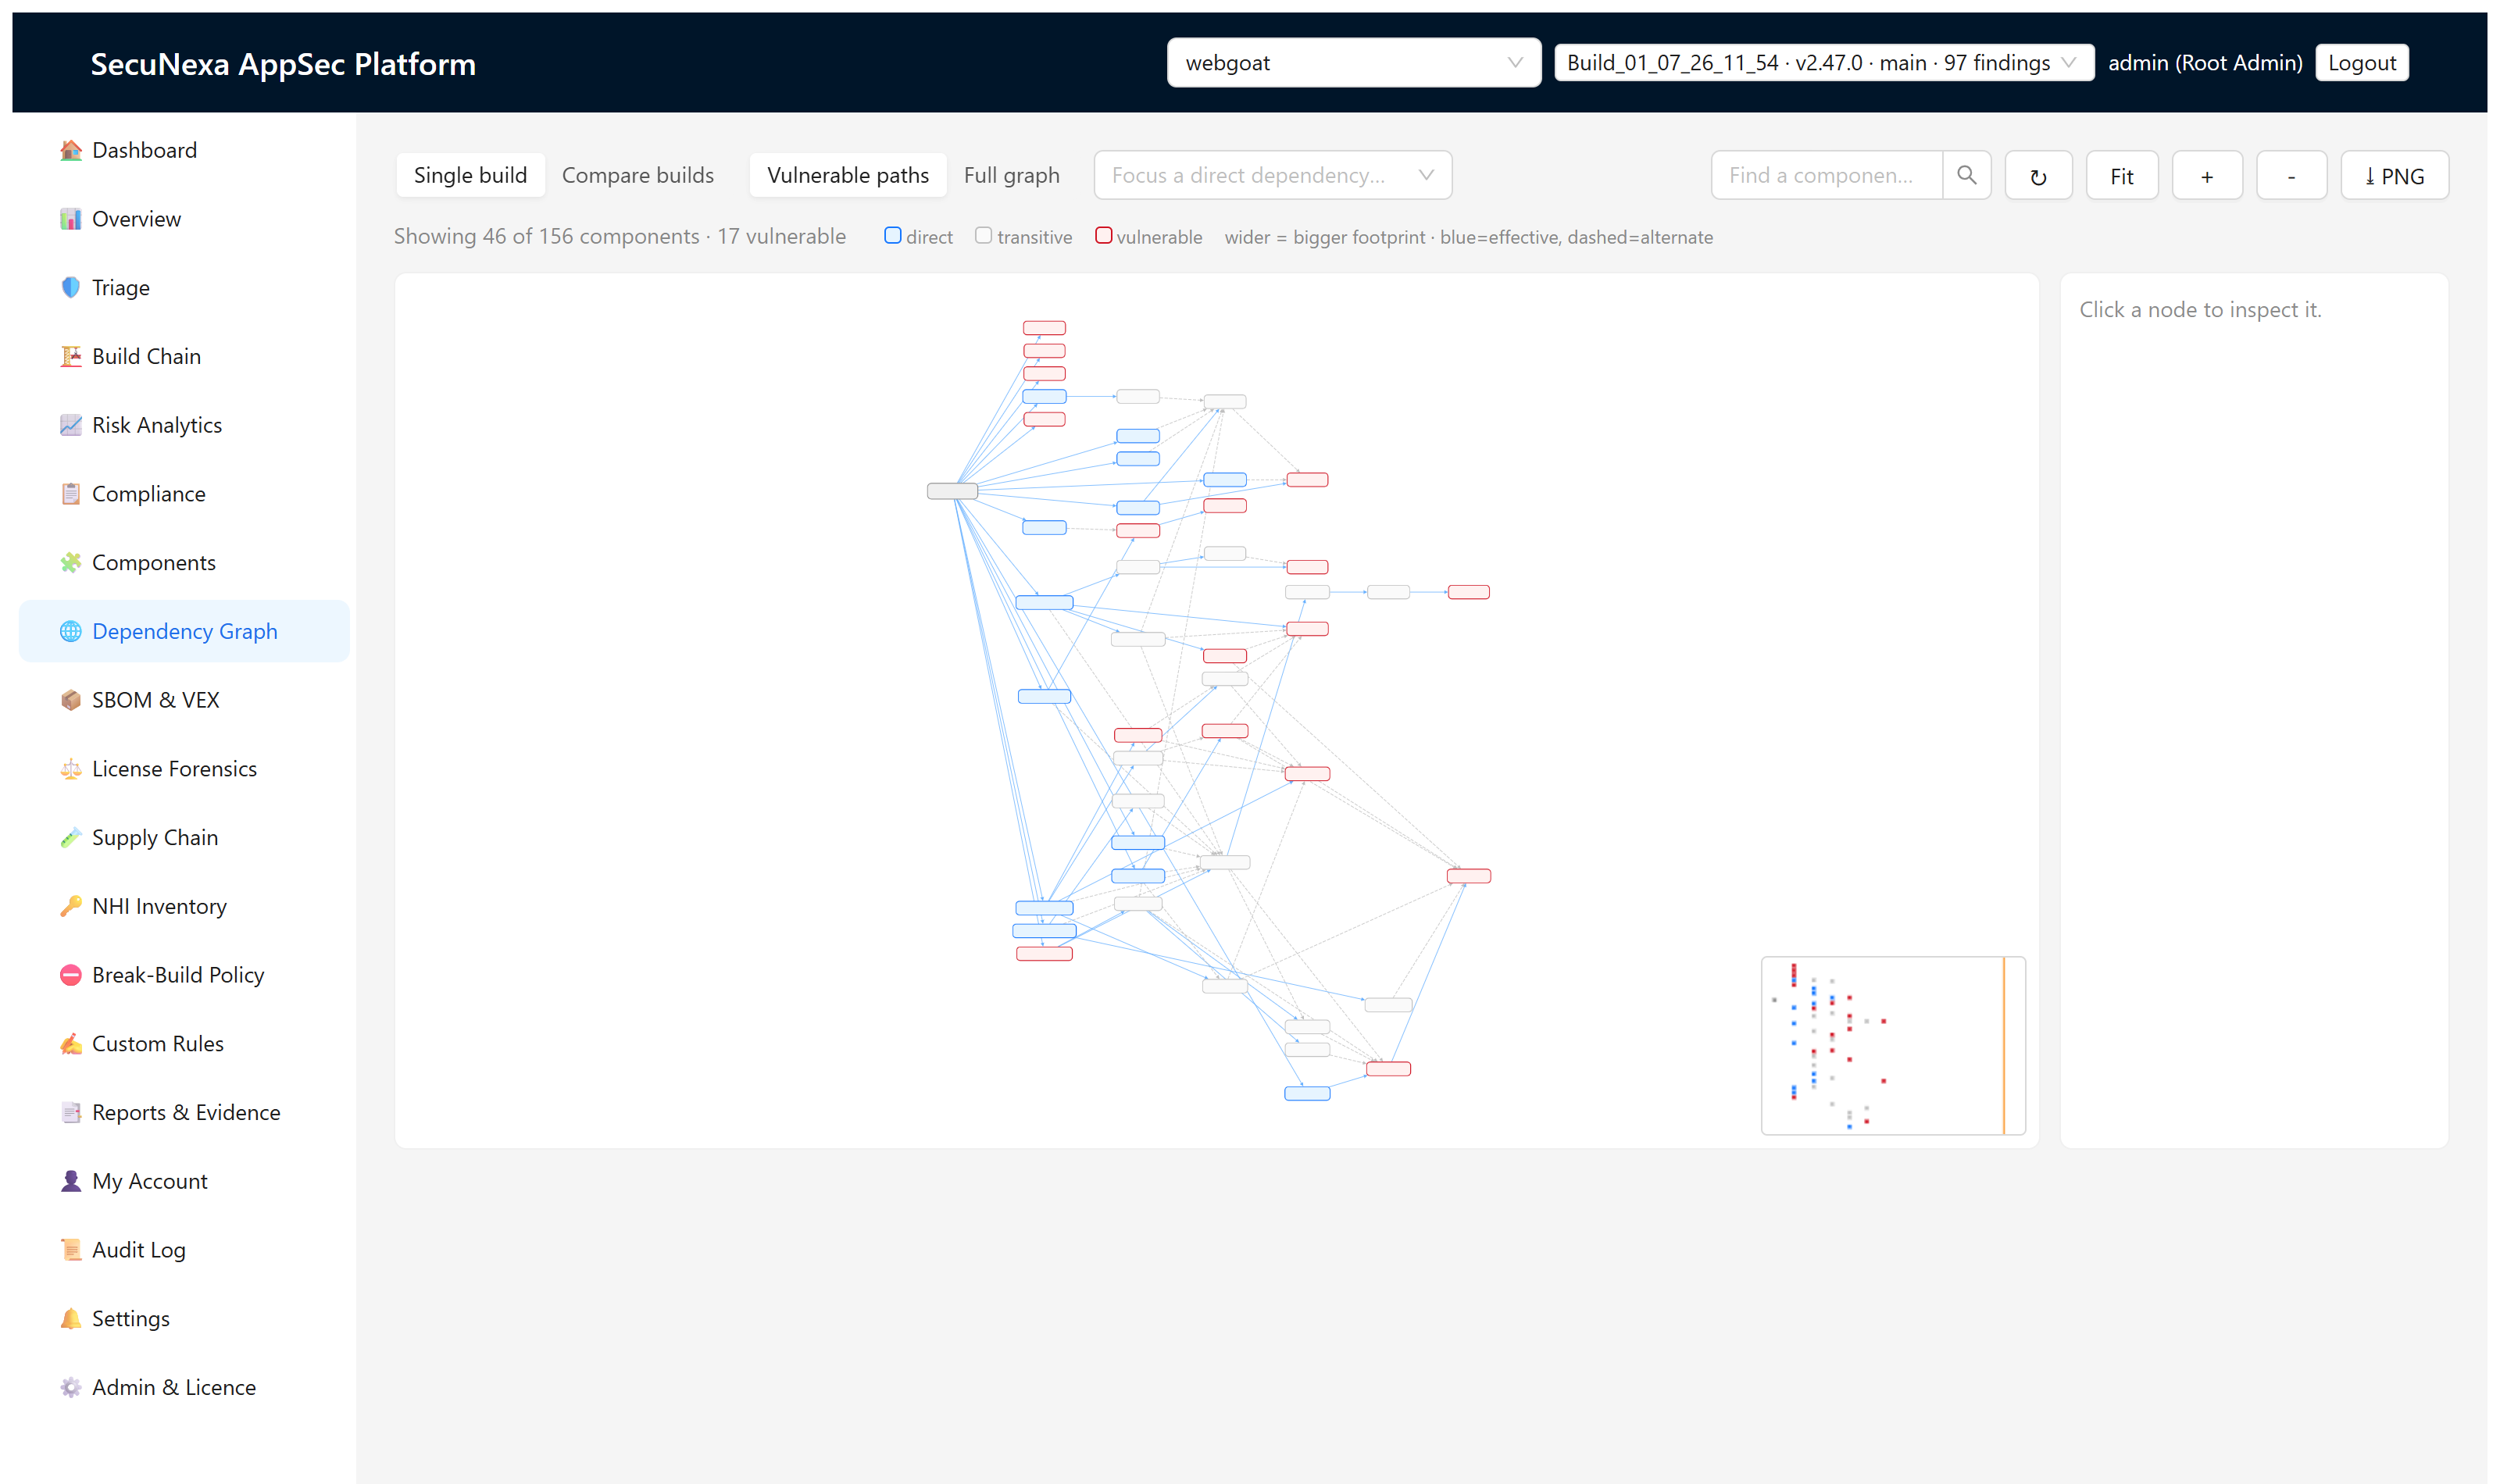
The real thing
Actual product, actual findings
These are unedited screenshots from a live SecuNexa dashboard analyzing WebGoat, the deliberately vulnerable benchmark application, in a demo environment.
Deployment
Built to live inside your network
One application, your database, your hardware. No SaaS control plane, no callbacks, no exceptions for licensing or updates.
| Deployment | On-premises, fully airgapped |
| Ingestion | Push from engines via CLI or CI |
| Authentication | Local accounts, MFA, optional LDAP/SSO |
| Data | Stays in your network, always |
See the full loop: scan, ingest, prioritize, fix, prove.
Request a demo